Physical activity monitoring in the Accofrisk AI watch. Part 1 — Overview.

Movement analysis tab.
This section provides a complete analysis of the state of the body systems depending on the user’s activity, lifestyle, physical activity and exercise. Take control of your body, set weight loss plans, and choose the right exercises to achieve your goals. Reduce the risks of overexertion by monitoring the parameters of the main body systems and the effects of sport on them.
The movement analysis section is divided into sub-sections
● Physical assessment.
● Today’s analysis.
● Sports daily.
● Sports Guide.
Physical Assessment tab.
The following skeletal muscle mass data can be monitored in this section:
● Height.
● Weight.
● MBI (Body mass index).
● RMR.
● Fat percentage.
● Muscle mass (%).
● Fat free mass.
Metabolic levels are categorized in the app as: low, normal, high. For example, if a user has a low metabolic level, they will see a report that reads something like this — “You may experience physical fatigue, lethargy or memory loss, and you are at increased risk of developing hyperlipidemia”.
The RMR (resting metabolic rate) parameter measures energy expenditure to maintain normal function and homeostasis of the human body, as well as the activity of the sympathetic nervous system. RMR in the app is measured at below or above average limits and is displayed on a continuous graph over a period of a week or month.
Interest (percentage) fat content, muscle mass are measured in below or above average limits and displayed on a continuous graph as a percentage. Body mass without fat is measured in the app in the same way in kilograms.

Nutritional Status.
Displayed in the application in the states:
● Normal.
● Mild malnutrition.
● Moderate malnutrition.
● Severe malnutrition.
● Overnutrition.
In each condition, inferences are formed both about consequences, such as increased fat mass, and the diagnoses that accompany the condition. For example, overeating leads to diseases such as obesity, hypertension, diabetes, and cardiovascular disease.
More data from the Physical Assessment tab.
Visceral Assessment.
Microcirculatory assessment consists of the body’s ability to absorb nutrients and excrete waste products and can be poor, average or good.
Assessment of cardiac function, reflecting the performance of the heart, can take the values of poor, average and good.
A brain function assessment can be good, average or poor and shows the energy reserves of brain tissue and the level of blood flow and oxygen supply to the brain.
Lung function assessment can be good, average or poor and refers to analyses of ventilation function and air exchange function. Low scores may indicate the onset of chronic disease.
A kidney function score may be good, moderate or poor and refers to the ability of the kidneys to perform the function of excreting waste products and poisons from the body during exercise.
For the Physical Assessment section of the appendix, based on the body condition indicators, a general conclusion on physical condition is formed, which includes recommendations to reduce health risks and forms recommendations on exercises to be performed to stabilize the body parameters and indicators of the section.
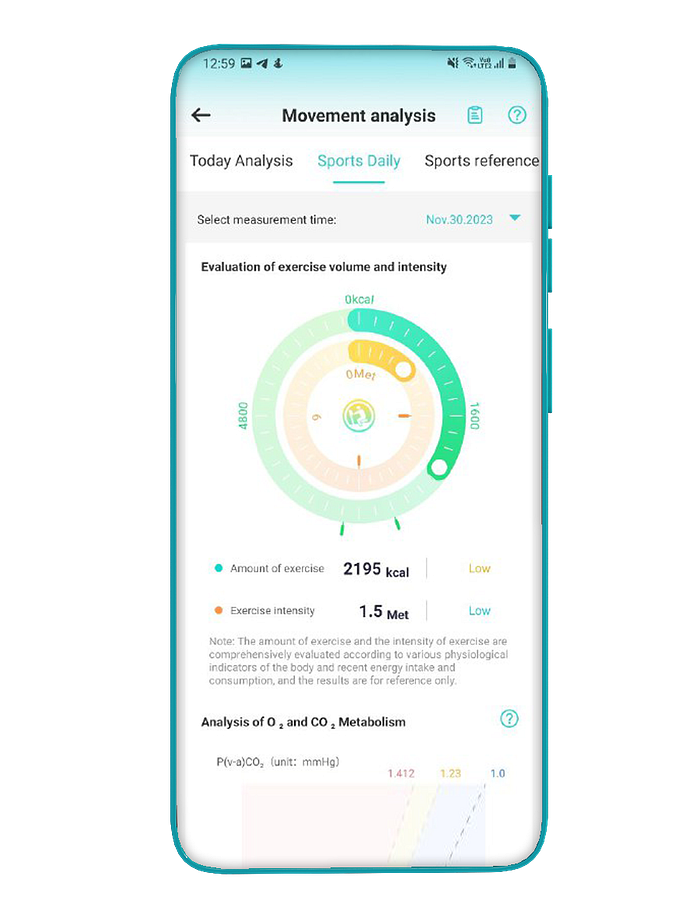
Sports Daily tab.
The user can select the measurement time of the section parameters. Exercise volume and intensity are comprehensively evaluated according to various physiological indicators of the body and recent energy intake.
The application screen shows a pie chart of Exercise Quantity in kilocalories and Exercise Intensity in Metabolic Equivalent of Task.
Other section parameters shown in the graphs are.
● Analyses of O and CO, metabolic P(v-a)CO, (unit: mmHg).
● Analyses of daily heat intake.
● Consumption and consumption of carbohydrates, fats and proteins.
It is particularly well worth mentioning the availability of graphs with trends in indicators related to daily physical exercise:
● Oxygen consumption.
● Cardiac output.
● Blood lactic acid content.
● Alveolar ventilation volume.
● Oxygen metabolism brain oxygen consumption.
● Myocardial blood demand.
● Cardiac ejection force.
● Entropy of respiration.
● Lung ventilation per minute.
● Blood urea nitrogen.
Here is a “live” example of an exercise rationality assessment formed at the end of training.
After extensive analysis, it has been determined that your current carbohydrate intake is low, protein intake is low, and fat intake is high. Your overall intake ratio is not balanced and does not meet the recommended intake.
There are no obvious abnormalities in your vitals, please pay attention to the changes in your vitals before and after exercise. Rational exercise can help improve blood circulation, improves brain nutrition, helps maintain energy and stabilize mood; It can promote heart muscle development, strong contraction, improve heart function.
Heart performance during exercise is monitored in the app over a selected period by the parameters:
● Efficient left ventricular energy utilization.
● Total final ejection fraction.
● Effective left ventricular pumping power.
● Cardiac function index.
● Left ventricular work capacity.
● Cardiac ejection force.
● Cardiac index.
● Left ventricular stroke work index.
Sport reference tab.
This section of the Accofrisk application shows your personalized health situation. For example, the following status tags are visible on the test user’s application screen:
● Poor metabolism.
● Obesity.
● Overeating.
● Low muscle mass.
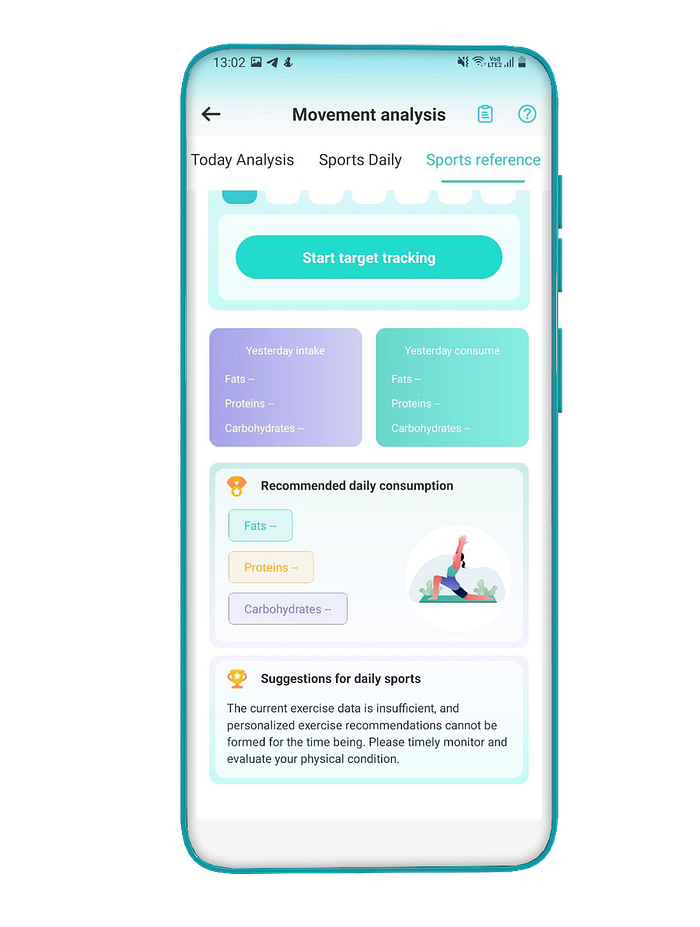
Next, the user can set goals and a timeframe to achieve them.
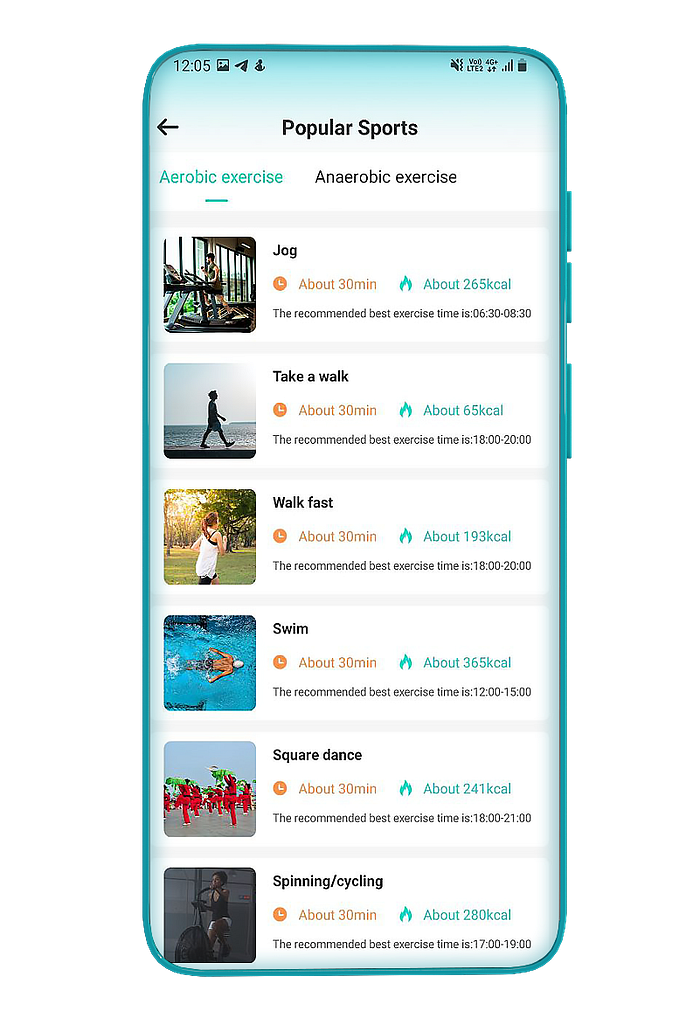
The screen shows two goals: to increase muscle mass by 132 grams and to reduce body fat by 439 grams in 7 days. In the Sports Guide, the user is presented with exercise sets, the time to perform them, the optimal time to start performing them and how many calories are burned during their performance.
There are all the exercise groups in the guide:
● Aerobic exercises.
● Anaerobic exercises.
● Jogging.
● Walking.
● Brisk walking.
● Swimming.
● Athletic dancing.
● Cycling/riding a bicycle.
Sport Weekly / Movement analysis tab.
In the app it is possible to track the weekly impact of sports loads and exercises. The user is given a separate rating from poor to perfect, and an overall health assessment is offered based on body dynamics and calorie intake data.
Other Sports Weekly assessments are.
● Sleep status.
● Assessment of physical fatigue.
● Mental state assessment.
● Blood sugar levels.
All graphs on assessments are generated in comparison to the previous week.
Job Preparation.
Before the user receives personalized exercise recommendations and can follow and track them, the AI will need some time to collect data about the user’s health status. Once the data has been collected and processed, in Today’s Analysis section.
We will explain how to use this section in the next part of the post.
About all the features of a non-invasive watch Accofrisk.
